SciLifeLab Prize: you still have time to participate!

I have recently been getting reminder emails from the Science & SciLifeLab Prize for Young Scientists. The application deadline is July 15th, 2018!
Last year I submitted an entry to this competition and I enjoyed the experience, even if it was a bit rushed. The process of joining the competition is relatively straight forward:
- Write an essay about your Ph.D. thesis work.
- Get a recommendation letter from your Ph.D. advisor.
- Write a short Ph.D. thesis abstract section, list your affiliation, education, academic and professional awards and professional experience.
- Include references.
You don’t need to pay for competing! You already did the very hard part of completing your Ph.D.!!! I also like competitions like this one that invite you to think about your thesis and how to explain it. You should note that you are only eligible to participate once in this competition.
You can read about the 4 winners from 2017 at www.sciencemag.org/prizes/SciLifeLab/2017 and other years too to draw some inspiration from. I didn’t win, but I’m still going to share my entry in case it’s useful to others. I’m also sharing it to keep with the theme of also sharing your failures that I talked in my mindfulness post.
I don’t know exactly why my entry was not selected (you might have some ideas on how to improve it!). But I can tell you that:
- I knew the deadline was coming but I wrote it the week it was due.
- I didn’t have time to ask for some more specific feedback from others.
- I forgot that a recommendation letter was needed, so I asked at the very last minute for one by Jeff Leek. I don’t know what magic he did (likely skipping a few hours of sleep, sorry!!!) but he managed to send it in time. Oops!
I’m not sure if I should have emphasized more the impact of my Ph.D. thesis work or what else to do. However, I do know that this exercise was useful. First, just re-reading my essay makes me smile. Also, Figure 1 shown here became a figure in the recount-workflow paper (Collado-Torres, Nellore, and Jaffe, 2017). Furthermore, when I was notified about the Thinkable Bioinformatics Peer Prize III I didn’t have to think twice about joining that competition. Finally, since I wrote it in an Rmd file, it was easy to modify for this blog post.
Like I’ve said, you have nothing to lose by joining this competition. Yes, you have to invest a bit of time. But it can be helpful and morale boosting! Plus, you have a chance to win it!!! Just remember that the deadline is July 15th, 2018 (and to give your advisor enough time to write their recommendation letter for you)!
In case you are curious, here are my full entry files (the figure is here though).
\[1\] L. Collado-Torres, A. Nellore, and A. E. Jaffe. “recount workflow: Accessing over 70,000 human RNA-seq samples with Bioconductor \[version 1; referees: 1 approved, 2 approved with reservations\]”. In: F1000Research (2017). DOI: 10.12688/f1000research.12223.1. URL: https://f1000research.com/articles/6-1558/v1.
Without further ado, here’s my full entry:
Usable human gene expression data and annotation-agnostic methods
In the last decade RNA sequencing (RNA-seq) has become the predominant assay for measuring gene expression. RNA-seq allows us to measure all expressed genes, improve gene and transcript annotation, and measure expressed sequences that otherwise are excluded in microarray studies. Typical RNA-seq analysis starts with a matrix containing the number of RNA-seq reads overlapping each gene for each sample (Michael I. Love et al. 2016; Law et al. 2016). To compute such a matrix, you first map the raw data to the genome with aligners such as TopHat2 and HISAT (Kim et al. 2013; Kim, Langmead, and Salzberg 2015) and then use tools such as Rsubread and HTSeq (Y, GK, and W 2013; Anders, Pyl, and Huber 2014) to construct the read count matrix. After measuring enough samples, you can determine which genes are differentially expressed between two or more groups.
When I started my graduate studies with Jeff Leek, the most commonly used methods for differential expression analysis were DESeq (Anders and Huber 2010) and edgeR (Robinson, McCarthy, and Smyth 2010). Leek and colleagues put together a set of gene count matrices in a project called ReCount (Alyssa C. Frazee, Langmead, and Leek 2011). ReCount allowed researchers to access several datasets without having to run the whole processing pipeline. ReCount then helped the development of new methods such as DESeq2 (Michael I. Love, Huber, and Anders 2014). It was also Leek and colleagues that decided to look at RNA-seq data in a manner less dependent on potentially incomplete gene annotation. With the increase in size of RNA-seq projects, they thought it would be feasible to assess the differential expression signal at base pair resolution in an approach called differentially expressed regions (DER) finder (Alyssa C. Frazee et al. 2014).
It was around then that I started to work with Andrew Jaffe, who had RNA-seq data from the human brain. Jaffe and colleagues hypothesized that the gene annotation for the human brain might be incomplete and were interested in applying the DER finder approach to their data. With them, I modified the DER finder approach to make it computationally feasible to analyze these human brain samples at base resolution (Jaffe et al. 2015). We indeed found that the human brain transcriptome was not fully annotated and identified intronic DERs that were present in other brain datasets, including from mouse, and showed these regions were enriched for genetic risk for brain disorders. Further computational improvements to the DER finder approach yielded the derfinder (Collado-Torres, Nellore, Frazee, et al. 2017) Bioconductor (Huber et al. 2015) package, reducing computing time from days to hours.
While I was working on derfinder, Abhinav Nellore was developing Rail-RNA (Nellore, Collado-Torres, et al. 2016) with the goal of aligning large RNA-seq datasets. We determined that we only needed coverage data instead of alignments to use derfinder and to perform gene level analyses. Coverage data files are much smaller than alignment files, which meant that we could greatly reduce our storage costs when using Rail-RNA and allowed us to think as big as possible. Initially we looked at 21,504 human RNA-seq samples and explored the landscape of exon-exon junctions (Nellore, Jaffe, et al. 2016). The reads spanning exon-exon junctions provided by Rail-RNA can be used for a second type of annotation-agnostic analysis as these reads provide information about exon skipping, alternative donor/acceptor sites and novel events. With a fairly conservative filter we determined that 18.6% of exon-exon junctions were missing in the annotation (Nellore, Jaffe, et al. 2016). This observation along with the fact that exon-exon junctions can be used to determine differential transcript usage gave strength to this second annotation-agnostic RNA-seq analysis method.
Researchers around the world have shared their raw data via the Sequence Read Archive or via large consortiums such as the Genotype-Tissue Expression study (GTEx) and the Cancer Genome Atlas (TCGA). However, it still is complicated to align and compute count matrices for these datasets. We thought that if the public data was uniformly processed that we could make this large body of human expression data more reusable. We were well positioned to carry out this project and just needed resources. Luckily, Jeff Leek, Ben Langmead and others got together and funded the implementation of Rail-RNA to analyze all the human public RNA-seq data available at the time, over 70,000 samples.
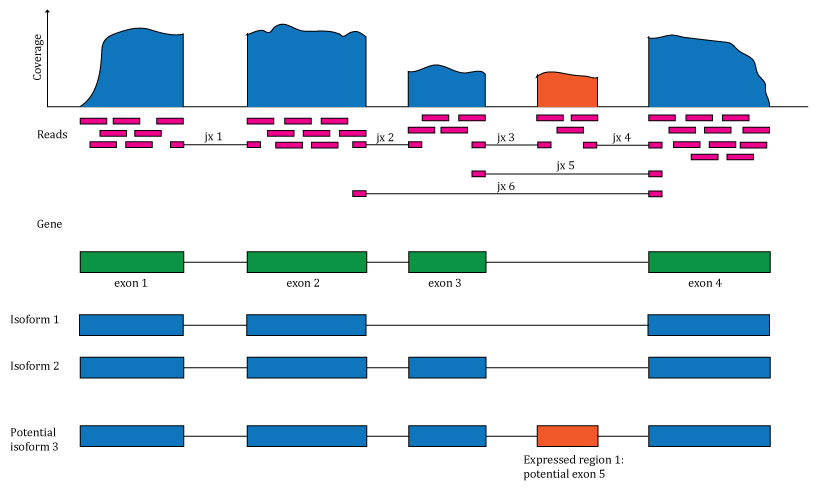
Figure 1: Overview of the data available in recount2. Reads aligned to the reference genome can be used to compute a base pair coverage curve, identify exon-exon junctions and compute gene and exon count matrices. The reads spanning exon-exon junctions (jx) are used to compute a third count matrix that includes un-annotated junctions (jx 3 and 4). Annotation-agnostic expressed regions can be determined from the coverage data.
We computed gene count matrices for these 70,000 samples and made them available as the recount2 resource that can be accessed at jhubiostatistics.shinyapps.io/recount/ as well as through the recount (Collado-Torres, Nellore, Kammers, et al. 2017) Bioconductor package, thus representing a major improvement over ReCount. To take advantage of the data as much as possible, we also released exon and exon-exon junction count matrices as well as the coverage data files required for the DER finder approach, thus enabling both annotation-agnostic methods we developed that complement traditional methods. Figure 1 illustrates the type of information that is available via recount2.
My colleagues and I believe that recount2 will fuel the development of new analytical methods and greatly increase the usability of the public human gene expression data researchers have collected over the years. In the meantime, we are working hard on improving the data in recount2 (Ellis, Collado-Torres, and Leek 2017; Wilks et al. 2017) and exploring how to leverage results from different RNA-seq analytical approaches (Jaffe et al. 2017).
Ph.D. thesis abstract
Leonardo Collado-Torres’ thesis work is centered around the development of R software packages for analyzing RNA sequencing (RNA-seq) and ChIP sequencing (ChIP-seq) high throughput genomic data. The first chapter describes the derfinder Bioconductor package which implements the DER Finder approach for identifying differentially expressed regions with RNA-seq data in an annotation-agnostic manner. The second chapter shows how derfinder can be applied to ChIP-seq data to identify differentially bounded regions. The third chapter describes the regionReport Bioconductor package for producing HTML or PDF reports from region-based genomic analyses, such as the derfinder analyses described in the previous chapters. The last thesis project Leonardo Collado-Torres carried out was the development of the recount2 resource and accompanying recount Bioconductor package using the Rail-RNA results from processing all the public human RNA-seq data at the time, which spans over 70,000 samples.
Affiliation
Lieber Institute for Brain Development, Johns Hopkins Medical Campus, Baltimore, Maryland, 21205, USA.
Education
- 2011-2016. Ph.D. in Biostatistics at Johns Hopkins Bloomberg School of Public Health, Baltimore, US. Advised by Jeff Leek and Andrew Jaffe.
- 2005-2009. Bachelor in Genomic Sciences (LCG) at the National Autonomous University of Mexico (UNAM), Cuernavaca, MX.
- 2002-2005. High school at ITESM Campus Cuernavaca, Cuernavaca, MX.
Academic and professional awards
- 2011: Awarded CONACyT Mexico scholarship for PhD studies outside Mexico.
- 2009: Summa Cum Laude for bachelor in Genomic Sciences studies at LCG-UNAM.
- 2005: Best high school average ($\sim$ 200 students): awarded ITESM system 90% scholarship for college studies, declined to join LCG-UNAM.
Professional experience
- 2016-current. Data Scientist with Andrew Jaffe lab at LIBD, Baltimore. At LIBD, Dr. Collado-Torres is part of the Data Science team which goals include better understanding and characterizing genomics signatures in the human brain, including DNA methylation and gene expression. Leonardo helps mentor other team members, provides support for LIBD projects and is advancing his academic career as part of Andrew Jaffe’s lab.
- 2009-2011. Bioinformatician with Enrique Morett lab at IBT-UNAM, Cuernavaca, MX. Identified transcriptions start sites and transcription units in Escherichia coli and Geobacter sulfurreducens with RNA-seq data. Developed the BacterialTranscription R package.
- 2009-2011. Scientific executive at Winter Genomics in Cuernavaca, MX. Responsible for recruiting and hiring new personnel, overseeing and supervising bioinformaticians, training new employees, writing research reports and presenting them to colleagues, and organizing all scientific projects.
- 2007-2009. Undergraduate research assistant at Guillermo Davila’s lab at CCG-UNAM, Cuernavaca, MX. Determined bacteriophage ecological groups by developing a method based on codon distribution of all phage sequenced genomes. Joint work with Sur Herrera Paredes.
- 2006-2007. Undergraduate research assistant at Roberto Kolter’s lab at Harvard, Boston, US. Supervisor: Elizabeth Shank. Carried out screenings to identify bacteria that activate the production of exopolysaccharide through the activation of the gene tasA in Bacillus subtilis.
References
Anders, Simon, and Wolfgang Huber. 2010. “Differential Expression Analysis for Sequence Count Data.” Genome Biology 11 (10): R106. https://doi.org/10.1186/gb-2010-11-10-r106.
Anders, Simon, Paul Theodor Pyl, and Wolfgang Huber. 2014. “HTSeq–a Python Framework to Work with High-Throughput Sequencing Data.” bioRxiv.
Collado-Torres, Leonardo, Abhinav Nellore, Alyssa C. Frazee, Christopher Wilks, Michael I. Love, Ben Langmead, Rafael A. Irizarry, Jeffrey T. Leek, and Andrew E. Jaffe. 2017. “Flexible Expressed Region Analysis for RNA-Seq with Derfinder.” Nucleic Acids Research 45 (2): e9–9. https://doi.org/10.1093/nar/gkw852.
Collado-Torres, Leonardo, Abhinav Nellore, Kai Kammers, Shannon E. Ellis, Margaret A. Taub, Kasper D. Hansen, Andrew E. Jaffe, Ben Langmead, and Jeffrey T. Leek. 2017. “Reproducible RNA-Seq Analysis Using Recount2.” Nature Biotechnology 35 (4): 319–21. https://doi.org/10.1038/nbt.3838.
Ellis, Shannon E, Leonardo Collado-Torres, and Jeffrey Leek. 2017. “Improving the Value of Public RNA-Seq Expression Data by Phenotype Prediction.” bioRxiv. https://doi.org/10.1101/145656.
Frazee, Alyssa C., Ben Langmead, and Jeffrey T. Leek. 2011. “ReCount: A Multi-Experiment Resource of Analysis-Ready RNA-Seq Gene Count Datasets.” BMC Bioinformatics 12: 449. https://doi.org/10.1186/1471-2105-12-449.
Frazee, Alyssa C, Sarven Sabunciyan, Kasper D Hansen, Rafael A Irizarry, and Jeffrey T Leek. 2014. “Differential Expression Analysis of RNA-seq Data at Single-Base Resolution.” Biostatistics (Oxford, England), January. https://doi.org/10.1093/biostatistics/kxt053.
Huber, Wolfgang, Vincent J Carey, Robert Gentleman, Simon Anders, Marc Carlson, Benilton S Carvalho, Hector Corrada Bravo, et al. 2015. “Orchestrating High-Throughput Genomic Analysis with Bioconductor.” Nature Methods 12 (2): 115–21. https://doi.org/10.1038/nmeth.3252.
Jaffe, Andrew E., Jooheon Shin, Leonardo Collado-Torres, Jeffrey T. Leek, Ran Tao, Chao Li, Yuan Gao, et al. 2015. “Developmental Regulation of Human Cortex Transcription and Its Clinical Relevance at Single Base Resolution.” Nature Neuroscience 18 (1): 154–61. https://doi.org/10.1038/nn.3898.
Jaffe, Andrew E., Richard Straub, Joo Heon Shin, Ran Tao, Yuan Gao, Leonardo Collado-Torres, Tony Kam-Thong, et al. 2017. “Developmental and genetic regulation of the human cortex transcriptome in schizophrenia.” bioRxiv.
Kim, Daehwan, Ben Langmead, and Steven L. Salzberg. 2015. “HISAT: A Fast Spliced Aligner with Low Memory Requirements.” Nature Methods 12 (4): 357–60. https://doi.org/10.1038/nmeth.3317.
Kim, Daehwan, Geo Pertea, Cole Trapnell, Harold Pimentel, Ryan Kelley, and Steven L Salzberg. 2013. “TopHat2: Accurate Alignment of Transcriptomes in the Presence of Insertions, Deletions and Gene Fusions.” Genome Biology 14 (4): R36. https://doi.org/10.1186/gb-2013-14-4-r36.
Law, Charity W, Monther Alhamdoosh, Shian Su, Gordon K Smyth, and Matthew E Ritchie. 2016. “RNA-seq analysis is easy as 1-2-3 with limma, Glimma and edgeR.” F1000Research 5 (May): 1408. https://doi.org/10.12688/f1000research.9005.2.
Love, Michael I., Simon Anders, Vladislav Kim, and Wolfgang Huber. 2016. “RNA-Seq workflow: gene-level exploratory analysis and differential expression.” F1000Research 4 (May): 1070. https://doi.org/10.12688/f1000research.7035.2.
Love, Michael I, Wolfgang Huber, and Simon Anders. 2014. “Moderated Estimation of Fold Change and Dispersion for RNA-Seq Data with DESeq2.” Genome Biology 15 (12): 1–21.
Nellore, Abhinav, Leonardo Collado-Torres, Andrew E. Jaffe, José Alquicira-Hernández, Christopher Wilks, Jacob Pritt, James Morton, Jeffrey T. Leek, and Ben Langmead. 2016. “Rail-RNA: Scalable Analysis of RNA-Seq Splicing and Coverage.” Bioinformatics (Oxford, England), September. https://doi.org/10.1093/bioinformatics/btw575.
Nellore, Abhinav, Andrew E. Jaffe, Jean-Philippe Fortin, José Alquicira-Hernández, Leonardo Collado-Torres, Siruo Wang, Robert A. Phillips Iii, et al. 2016. “Human Splicing Diversity and the Extent of Unannotated Splice Junctions Across Human RNA-Seq Samples on the Sequence Read Archive.” Genome Biology 17 (1): 266.
Robinson, Mark D, Davis J McCarthy, and Gordon K Smyth. 2010. “edgeR: A Bioconductor Package for Differential Expression Analysis of Digital Gene Expression Data.” Bioinformatics (Oxford, England) 26 (1): 139–40. https://doi.org/10.1093/bioinformatics/btp616.
Wilks, Christopher, Phani Gaddipati, Abhinav Nellore, and Benjamin Langmead. 2017. “Snaptron: querying and visualizing splicing across tens of thousands of RNA-seq samples.” bioRxiv. https://doi.org/10.1101/097881.
Y, Liao, Smyth GK, and Shi W. 2013. “The Subread Aligner: Fast, Accurate and Scalable Read Mapping by Seed-and-Vote.” Nucleic Acids Research 41: e108.
Leonardo Collado-Torres
Investigator @ LIBD, Assistant Professor, Department of Biostatistics @ JHBSPH
#rstats @Bioconductor/🧠 genomics @LieberInstitute/@lcgunam @jhubiostat @jtleek @andrewejaffe alumni/@LIBDrstats @CDSBMexico co-founder