Data Science guidance session logs
Overview
This website contains the public logs for the Data Science guidance sessions (DSgs).
Graphs
Below we see the number of DSgs sessions for each of the guides across time. You can mouse-over each point to see the data, or click on each guide’s name to hide/show their information. The data is filtered to show only active DSgs guides.
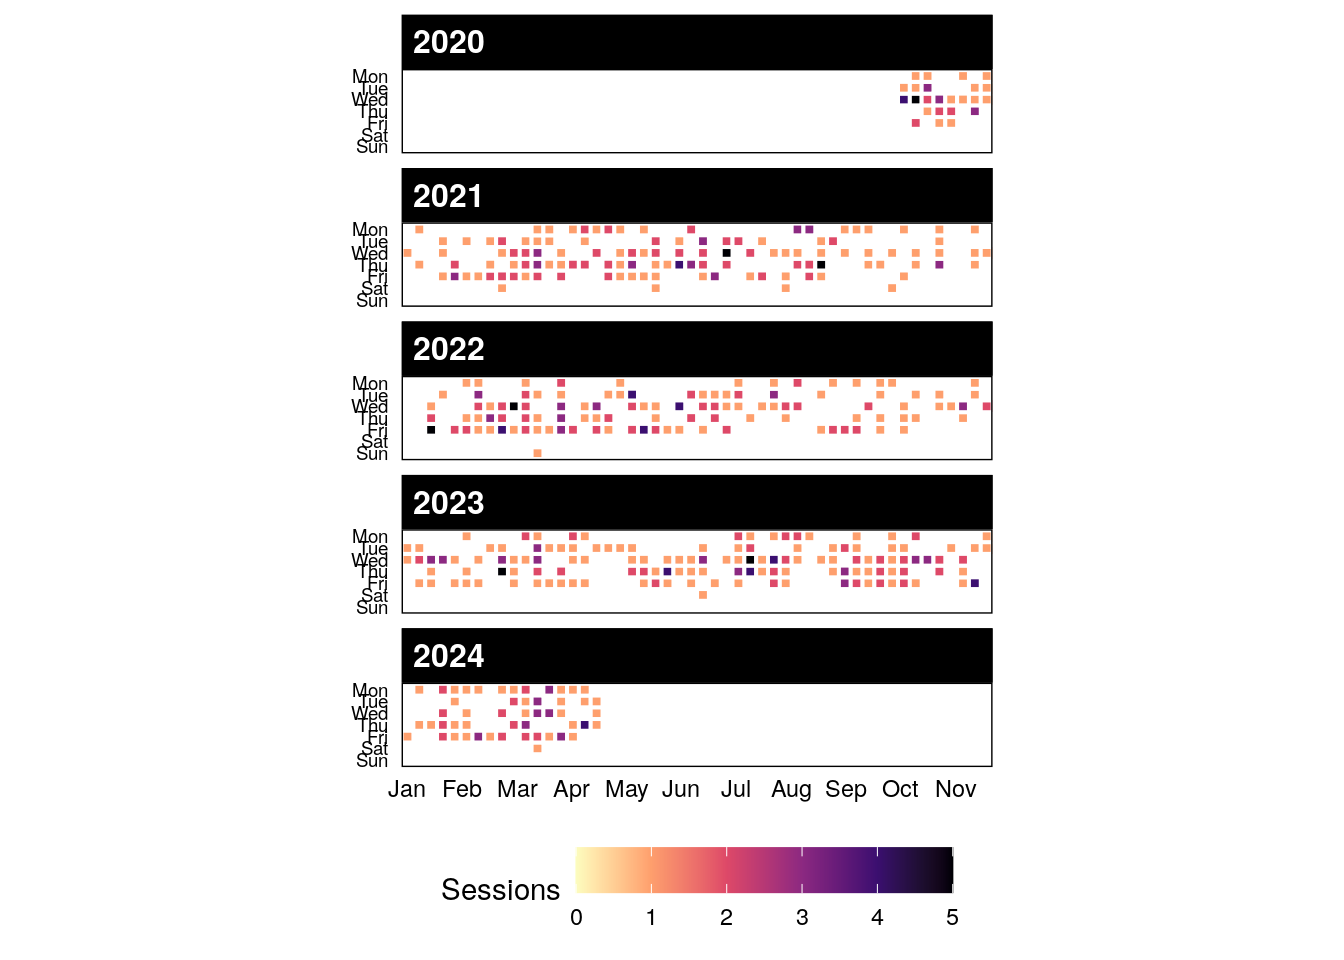
As a team, this is the overall number of help requests we have completed over time grouped by day and year.
These graphs are partially based on lcolladotor/mphtasessions and GitHub-style waffle plots in R.