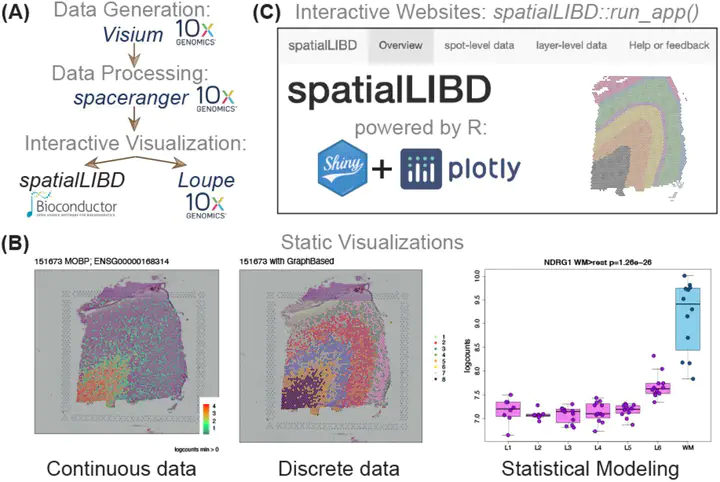
spatialLIBD: an R/Bioconductor package to visualize spatially-resolved transcriptomics data
 Image credit: bioRxiv
Abstract
Background. Spatially-resolved transcriptomics has now enabled the quantification of high-throughput and transcriptome-wide gene expression in intact tissue while also retaining the spatial coordinates. Incorporating the precise spatial mapping of gene activity advances our understanding of intact tissue-specific biological processes. In order to interpret these novel spatial data types, interactive visualization tools are necessary. Results. We describe spatialLIBD, an R/Bioconductor package to interactively explore spatially-resolved transcriptomics data generated with the 10x Genomics Visium platform. The package contains functions to interactively access, visualize, and inspect the observed spatial gene expression data and data-driven clusters identified with supervised or unsupervised analyses, either on the user’s computer or through a web application. Conclusions. spatialLIBD is available at https://bioconductor.org/packages/spatialLIBD. It is fully compatible with SpatialExperiment and the Bioconductor ecosystem. Its functionality facilitates analyzing and interactively exploring spatially-resolved data from the Visium platform.
Our paper describing our package #spatialLIBD is finally out! 🎉🎉🎉
— Brenda Pardo (@PardoBree) April 30, 2021
spatialLIBD is an #rstats / @Bioconductor package to visualize spatial transcriptomics data.
⁰
This is especially exciting for me as it is my first paper as a first author 🦑.https://t.co/COW013x4GA
1/9 pic.twitter.com/xevIUg3IsA