Publications
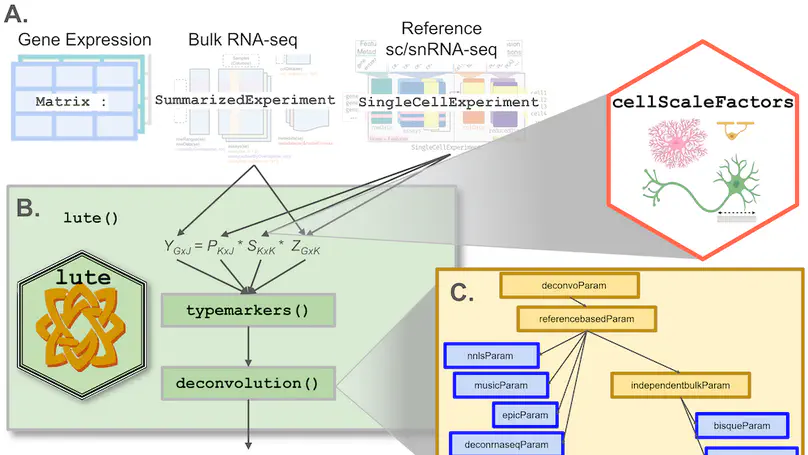
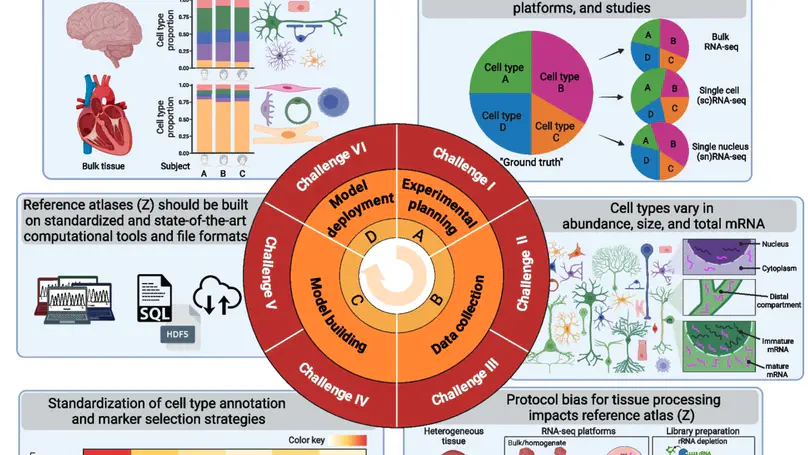
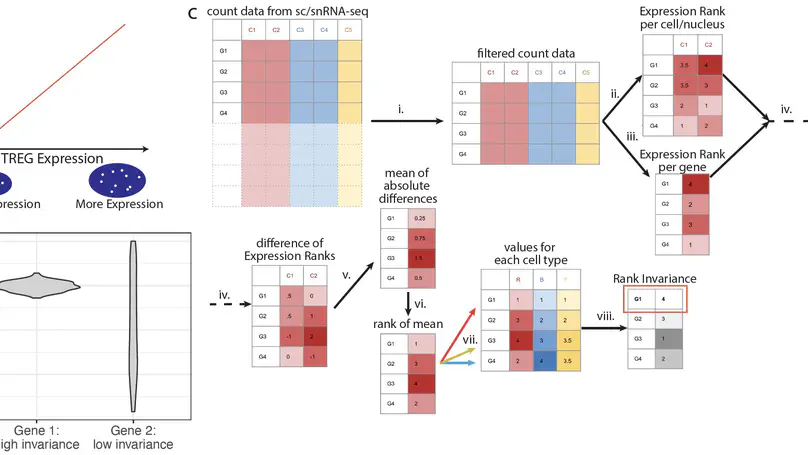
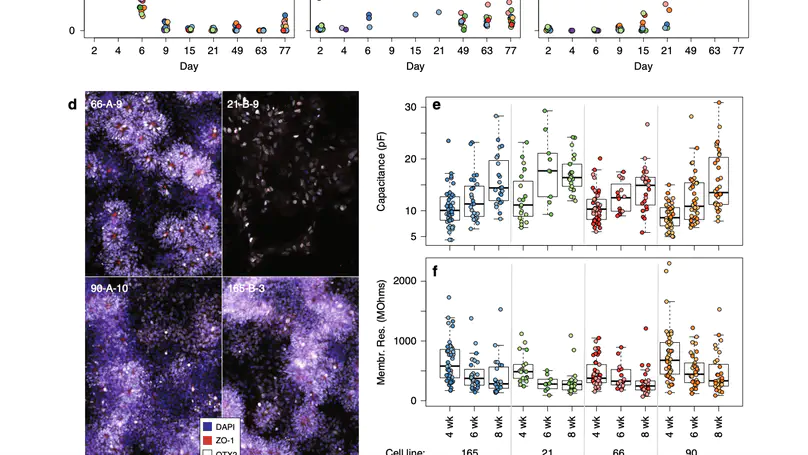
Background: Relative cell type fraction estimates in bulk RNA-sequencing data are important to control for cell composition differences across heterogenous tissue samples. While there exist algorithms to estimate the cell type proportions in tissues, a major challenge is the algorithms can show reduced performance if using tissues that have varying cell sizes, such as in brain tissue. In this way, without adjusting for differences in cell sizes, computational algorithms estimate the relative fraction of RNA attributable to each cell type, rather than the relative fraction of cell types, leading to potentially biased estimates in cellular composition. Furthermore, these tools were built on different frameworks with non-uniform input data formats while addressing different types of systematic errors or unwanted bias. Results: We present lute, a software tool to accurately deconvolute cell types with varying sizes. Our package lute wraps existing deconvolution algorithms in a flexible and extensible framework to enable easy benchmarking and comparison of existing deconvolution algorithms. Using simulated and real datasets, we demonstrate how lute adjusts for differences in cell sizes to improve the accuracy of cell composition. Conclusions: Our software (https://bioconductor.org/packages/lute) can be used to enhance and improve existing deconvolution algorithms and can be used broadly for any type of tissue containing cell types with varying cell sizes.
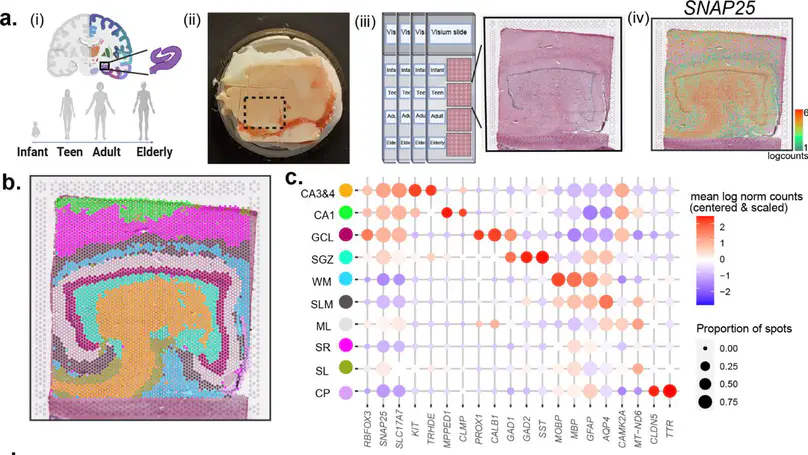
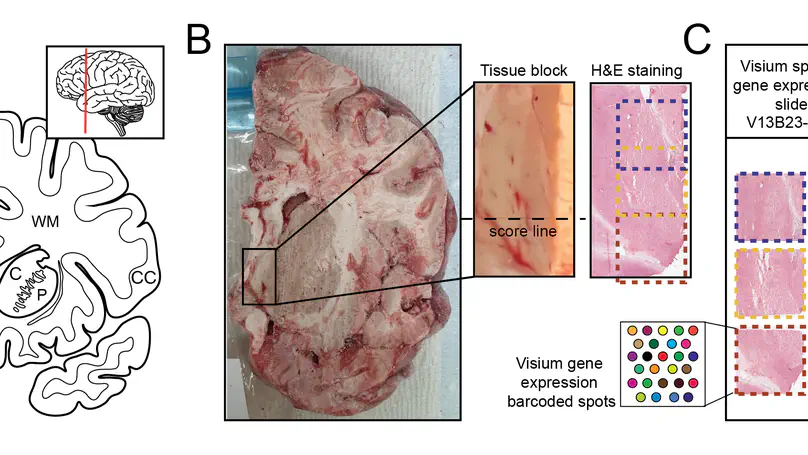
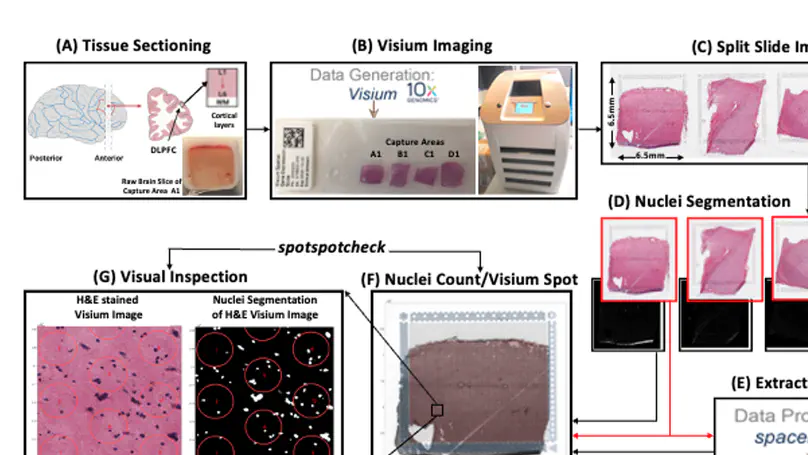
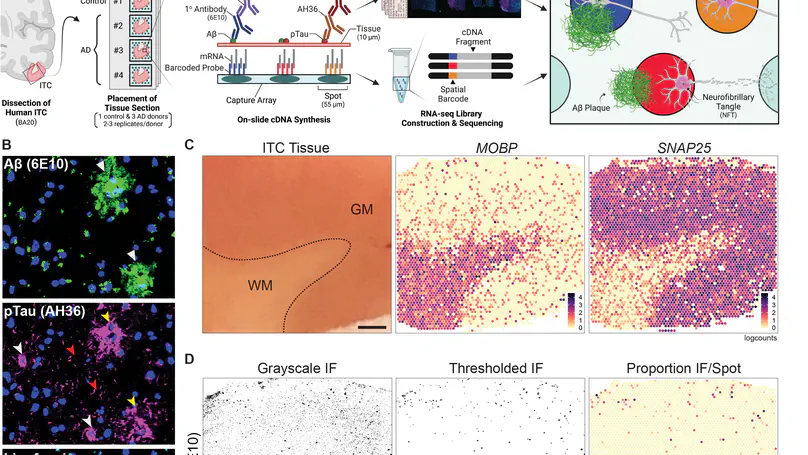
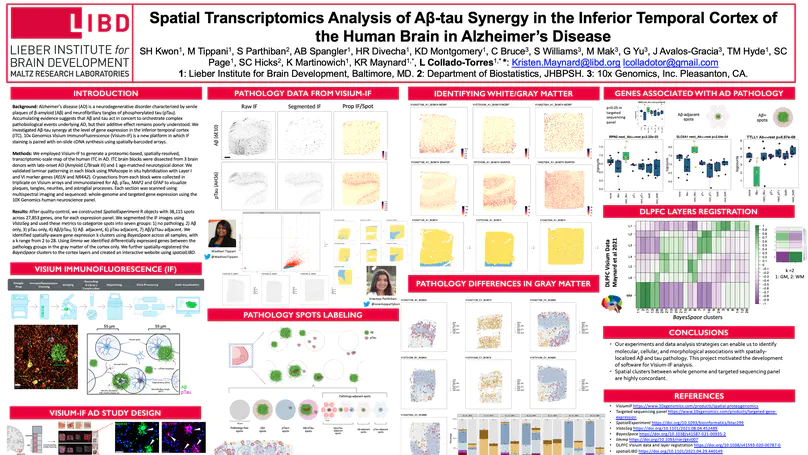
Spatially resolved transcriptomics (SRT) is a growing field that links gene expression to anatomical context. SRT approaches that use next-generation sequencing (NGS) combine RNA sequencing with histological or fluorescent imaging to generate spatial maps of gene expression in intact tissue sections. These technologies directly couple gene expression measurements with high-resolution histological or immunofluorescent images that contain rich morphological information about the tissue under study. While broad access to NGS-based spatial transcriptomic technology is now commercially available through the Visium platform from the vendor 10× Genomics, computational tools for extracting image-derived metrics for integration with gene expression data remain limited. We developed VistoSeg as a MATLAB pipeline to process, analyze and interactively visualize the high-resolution images generated in the Visium platform. VistoSeg outputs can be easily integrated with accompanying transcriptomic data to facilitate downstream analyses in common programing languages including R and Python. VistoSeg provides user-friendly tools for integrating image-derived metrics from histological and immunofluorescent images with spatially resolved gene expression data. Integration of this data enhances the ability to understand the transcriptional landscape within tissue architecture. VistoSeg is freely available at http://research.libd.org/VistoSeg/.
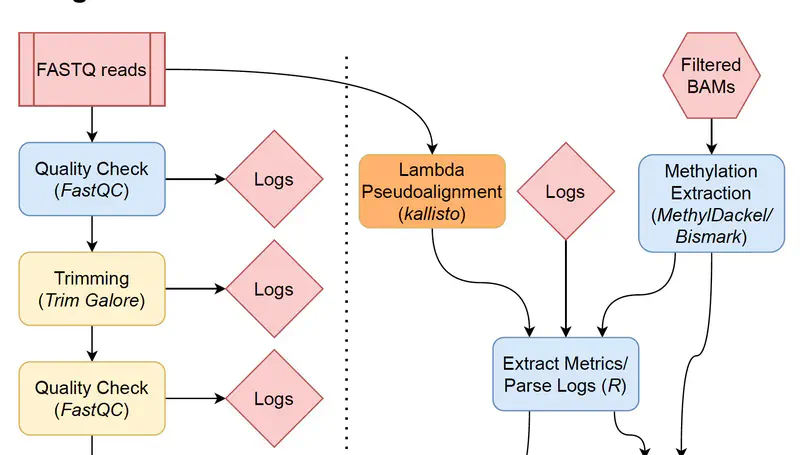
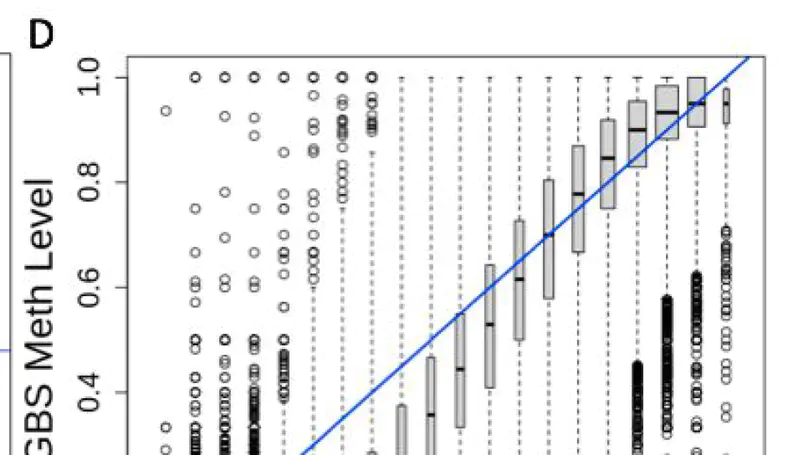
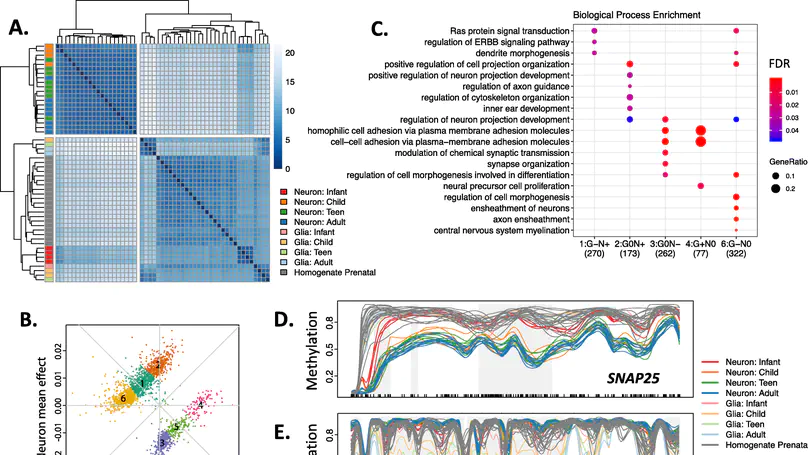
Background Bisulfite sequencing is a powerful tool for profiling genomic methylation, an epigenetic modification critical in the understanding of cancer, psychiatric disorders, and many other conditions. Raw data generated by whole genome bisulfite sequencing (WGBS) requires several computational steps before it is ready for statistical analysis, and particular care is required to process data in a timely and memory-efficient manner. Alignment to a reference genome is one of the most computationally demanding steps in a WGBS workflow, taking several hours or even days with commonly used WGBS-specific alignment software. This naturally motivates the creation of computational workflows that can utilize GPU-based alignment software to greatly speed up the bottleneck step. In addition, WGBS produces raw data that is large and often unwieldy; a lack of memory-efficient representation of data by existing pipelines renders WGBS impractical or impossible to many researchers. Results We present BiocMAP, a Bioconductor-friendly methylation analysis pipeline consisting of two modules, to address the above concerns. The first module performs computationally-intensive read alignment using Arioc, a GPU-accelerated short-read aligner. Since GPUs are not always available on the same computing environments where traditional CPU-based analyses are convenient, the second module may be run in a GPU-free environment. This module extracts and merges DNA methylation proportions—the fractions of methylated cytosines across all cells in a sample at a given genomic site. Bioconductor-based output objects in R utilize an on-disk data representation to drastically reduce required main memory and make WGBS projects computationally feasible to more researchers. Conclusions BiocMAP is implemented using Nextflow and available at http://research.libd.org/BiocMAP/. To enable reproducible analysis across a variety of typical computing environments, BiocMAP can be containerized with Docker or Singularity, and executed locally or with the SLURM or SGE scheduling engines. By providing Bioconductor objects, BiocMAP’s output can be integrated with powerful analytical open source software for analyzing methylation data.
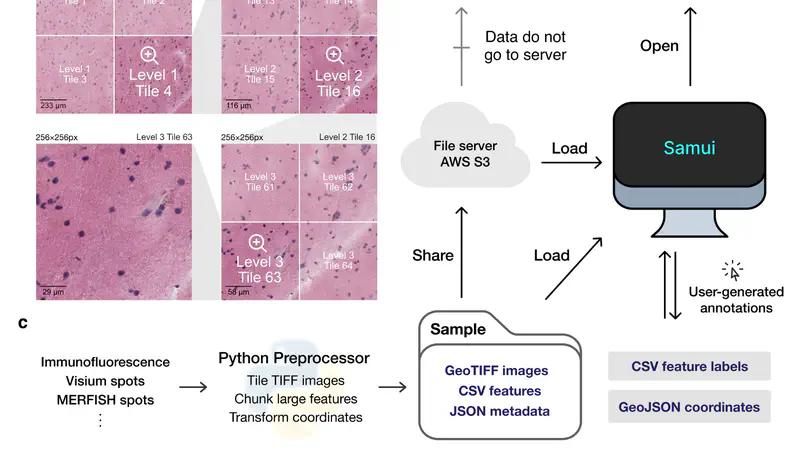
High-resolution and multiplexed imaging techniques are giving us an increasingly detailed observation of a biological system. However, sharing, exploring, and customizing the visualization of large multidimensional images can be a challenge. Here, we introduce Samui, a performant and interactive image visualization tool that runs completely in the web browser. Samui is specifically designed for fast image visualization and annotation and enables users to browse through large images and their selected features within seconds of receiving a link. We demonstrate the broad utility of Samui with images generated with two platforms: Vizgen MERFISH and 10x Genomics Visium Spatial Gene Expression. Samui along with example datasets is available at https://samuibrowser.com.
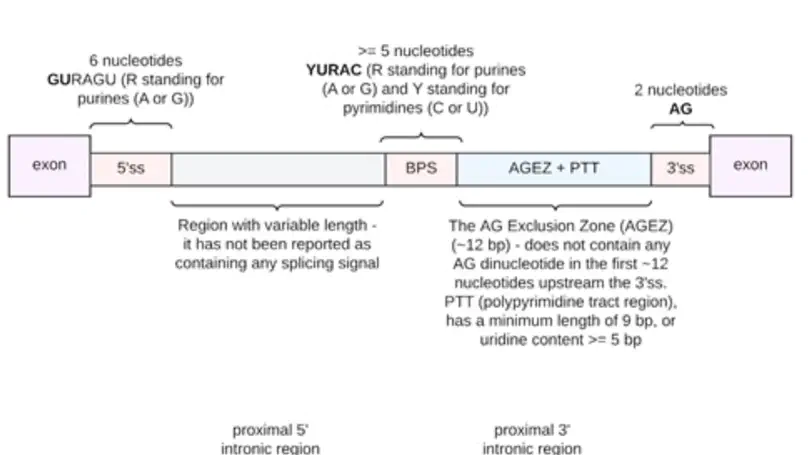
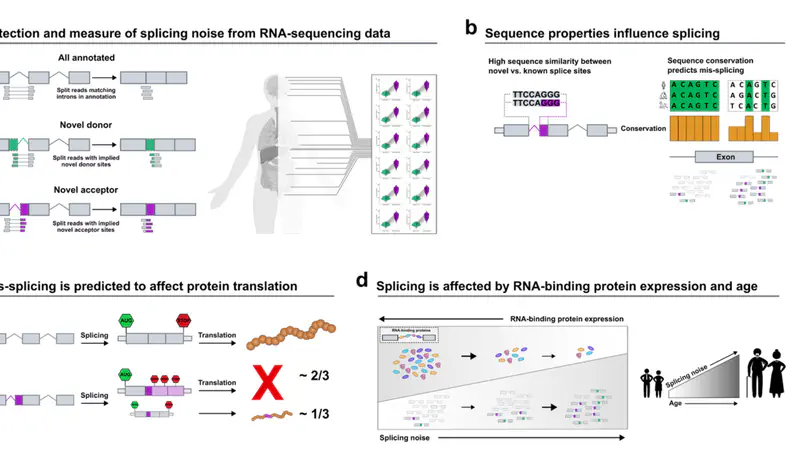
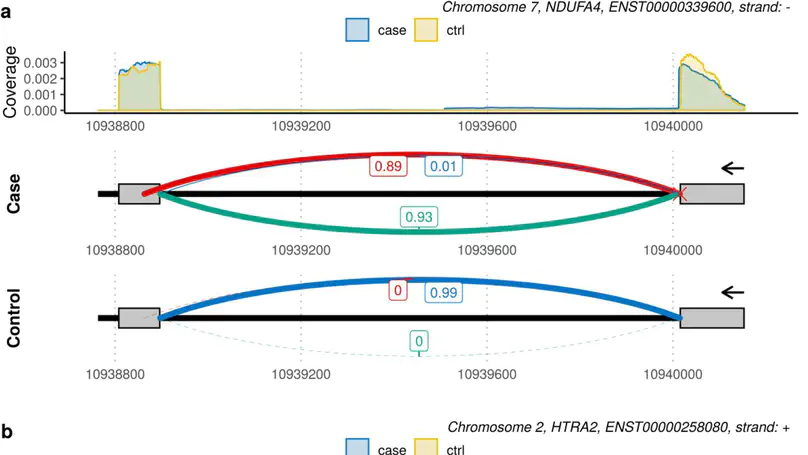
Dysregulation of RNA splicing contributes to both rare and complex diseases. RNA-sequencing data from human tissues has shown that this process can be inaccurate, resulting in the presence of novel introns detected at low frequency across samples and within an individual. To enable the full spectrum of intron use to be explored, we have developed IntroVerse, which offers an extensive catalogue on the splicing of 332,571 annotated introns and a linked set of 4,679,474 novel junctions covering 32,669 different genes. This dataset has been generated through the analysis of 17,510 human control RNA samples from 54 tissues provided by the Genotype-Tissue Expression Consortium. IntroVerse has two unique features: (i) it provides a complete catalogue of novel junctions and (ii) each novel junction has been assigned to a specific annotated intron. This unique, hierarchical structure offers multiple uses, including the identification of novel transcripts from known genes and their tissue-specific usage, and the assessment of background splicing noise for introns thought to be mis-spliced in disease states. IntroVerse provides a user-friendly web interface and is freely available at https://rytenlab.com/browser/app/introverse.
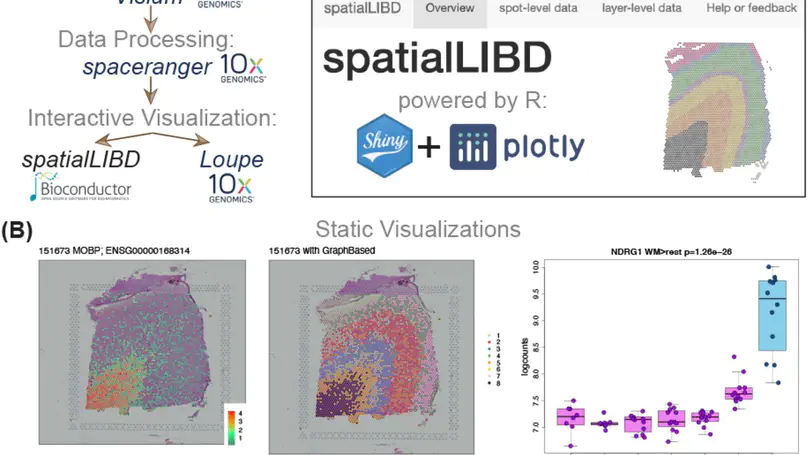
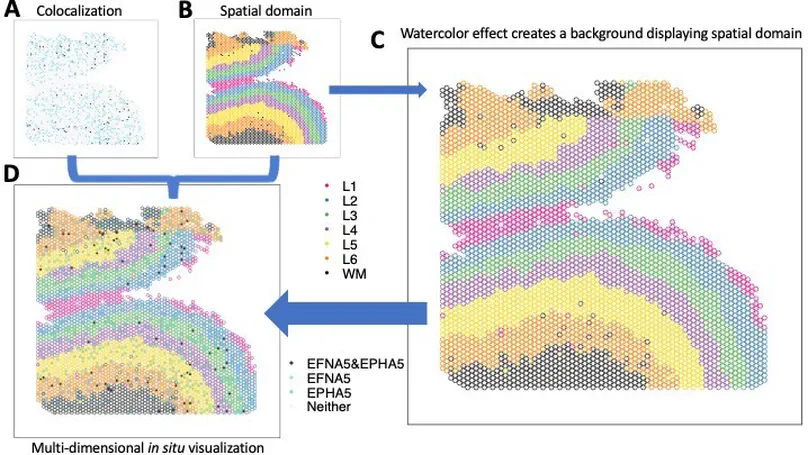
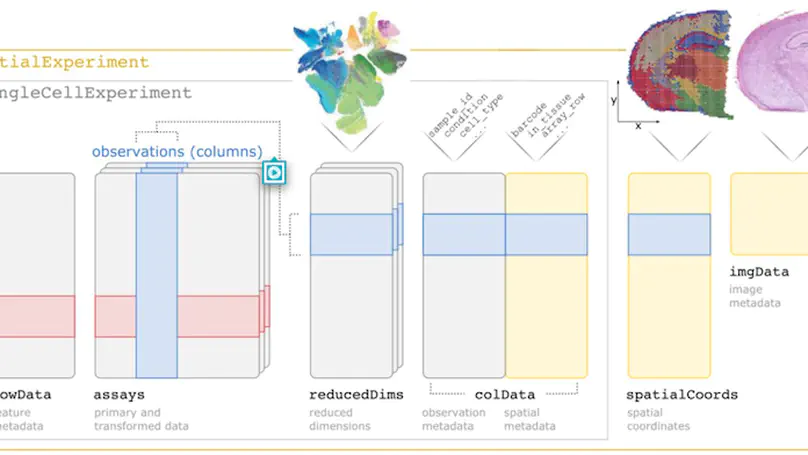
Background. Spatially-resolved transcriptomics has now enabled the quantification of high-throughput and transcriptome-wide gene expression in intact tissue while also retaining the spatial coordinates. Incorporating the precise spatial mapping of gene activity advances our understanding of intact tissue-specific biological processes. In order to interpret these novel spatial data types, interactive visualization tools are necessary. Results. We describe spatialLIBD, an R/Bioconductor package to interactively explore spatially-resolved transcriptomics data generated with the 10x Genomics Visium platform. The package contains functions to interactively access, visualize, and inspect the observed spatial gene expression data and data-driven clusters identified with supervised or unsupervised analyses, either on the user’s computer or through a web application. Conclusions. spatialLIBD is available at https://bioconductor.org/packages/spatialLIBD. It is fully compatible with SpatialExperiment and the Bioconductor ecosystem. Its functionality facilitates analyzing and interactively exploring spatially-resolved data from the Visium platform.
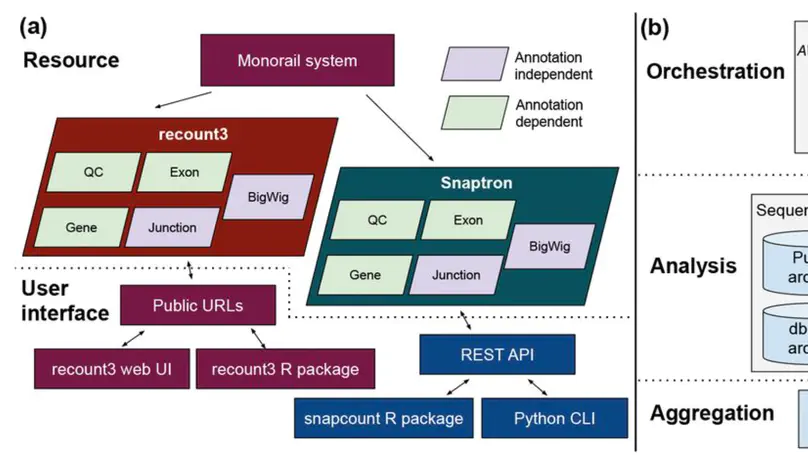
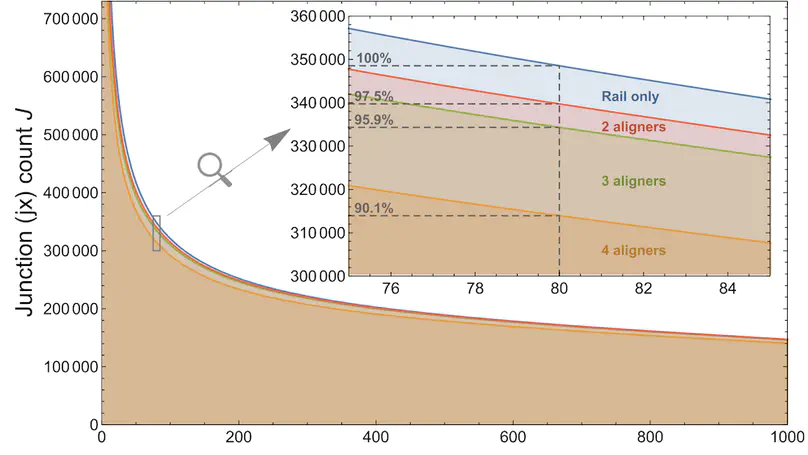
We present recount3, a resource consisting of over 750,000 publicly available human and mouse RNA sequencing (RNA-seq) samples uniformly processed by our new Monorail analysis pipeline. To facilitate access to the data, we provide the recount3 and snapcount R/Bioconductor packages as well as complementary web resources. Using these tools, data can be downloaded as study-level summaries or queried for specific exon-exon junctions, genes, samples, or other features. Monorail can be used to process local and/or private data, allowing results to be directly compared to any study in recount3. Taken together, our tools help biologists maximize the utility of publicly available RNA-seq data, especially to improve their understanding of newly collected data. recount3 is available from http://rna.recount.bio.
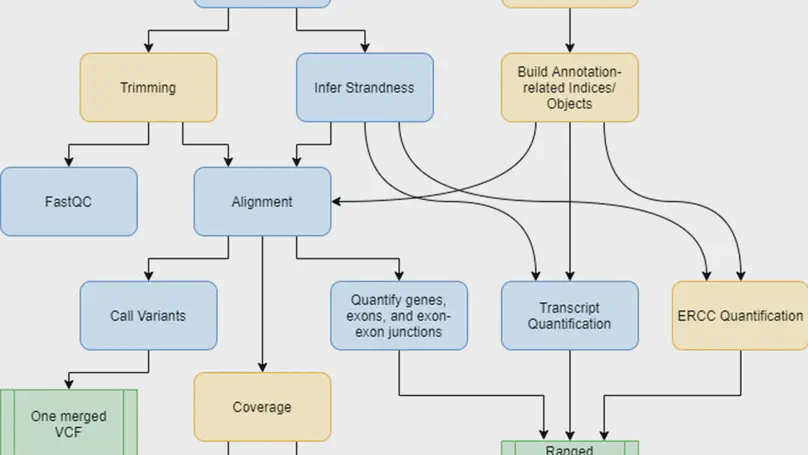
Background. RNA sequencing (RNA-seq) is a common and widespread biological assay, and an increasing amount of data is generated with it. In practice, there are a large number of individual steps a researcher must perform before raw RNA-seq reads yield directly valuable information, such as differential gene expression data. Existing software tools are typically specialized, only performing one step–such as alignment of reads to a reference genome–of a larger workflow. The demand for a more comprehensive and reproducible workflow has led to the production of a number of publicly available RNA-seq pipelines. However, we have found that most require computational expertise to set up or share among several users, are not actively maintained, or lack features we have found to be important in our own analyses. Results. In response to these concerns, we have developed a Scalable Pipeline for Expression Analysis and Quantification (SPEAQeasy), which is easy to install and share, and provides a bridge towards R/Bioconductor downstream analysis solutions. SPEAQeasy is portable across computational frameworks (SGE, SLURM, local, docker integration) and different configuration files are provided (http://research.libd.org/SPEAQeasy/). Conclusions. SPEAQeasy is user-friendly and lowers the computational-domain entry barrier for biologists and clinicians to RNA-seq data processing as the main input file is a table with sample names and their corresponding FASTQ files. The goal is to provide a flexible pipeline that is immediately usable by researchers, regardless of their technical background or computing environment.
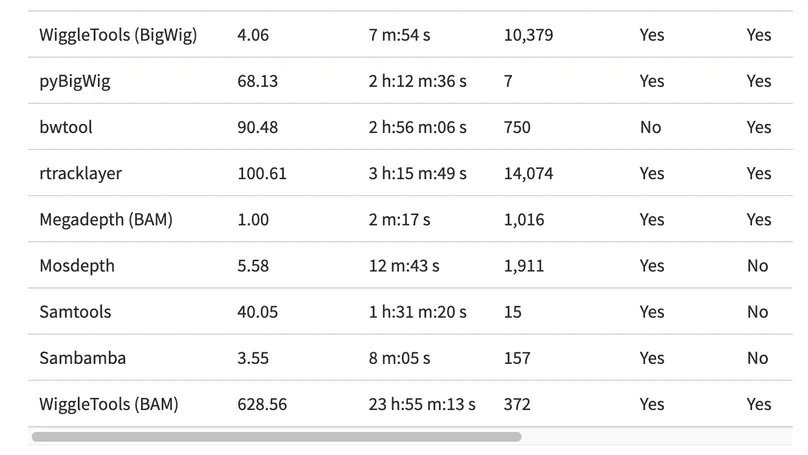
Motivation. A common way to summarize sequencing datasets is to quantify data lying within genes or other genomic intervals. This can be slow and can require different tools for different input file types. Results. Megadepth is a fast tool for quantifying alignments and coverage for BigWig and BAM/CRAM input files, using substantially less memory than the next-fastest competitor. Megadepth can summarize coverage within all disjoint intervals of the Gencode V35 gene annotation for more than 19 000 GTExV8 BigWig files in approximately 1 h using 32 threads. Megadepth is available both as a command-line tool and as an R/Bioconductor package providing much faster quantification compared to the rtracklayer package. Availability and implementation: https://github.com/ChristopherWilks/megadepth, https://bioconductor.org/packages/megadepth.
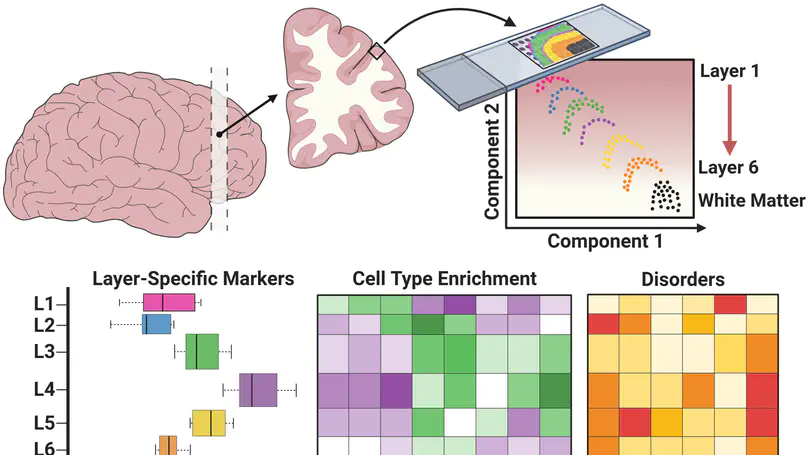
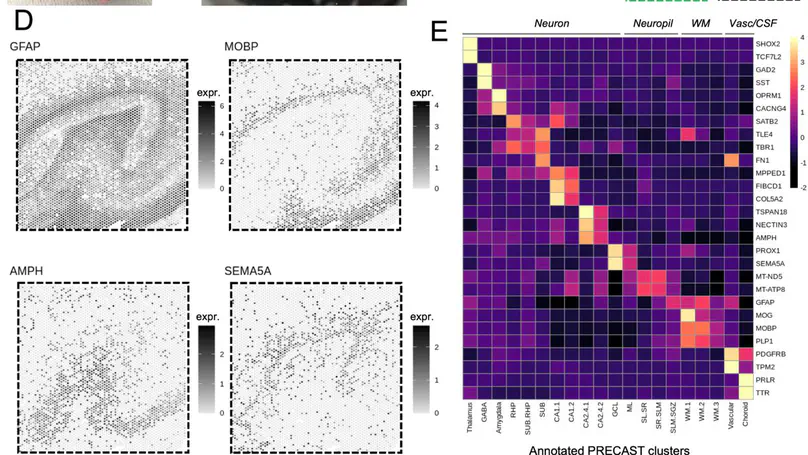
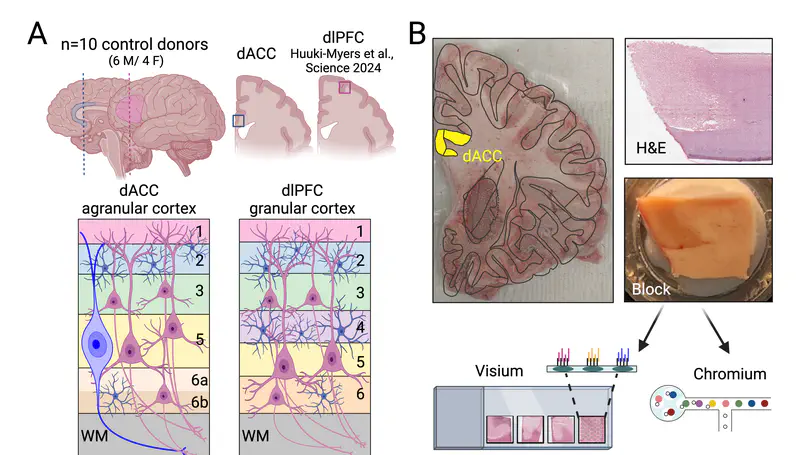
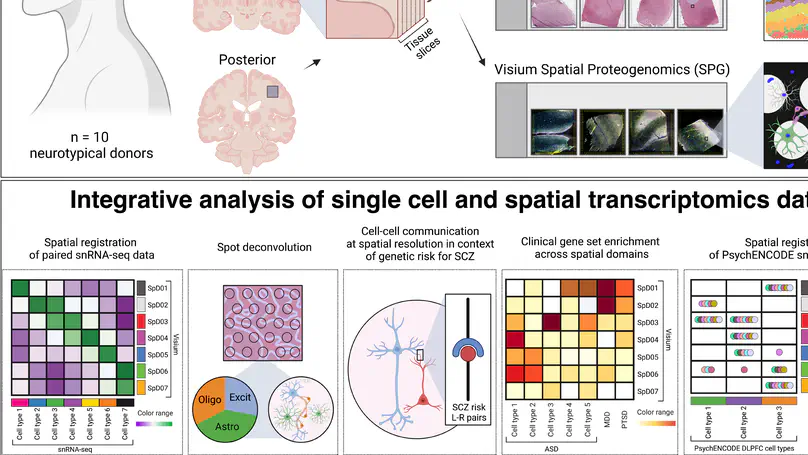
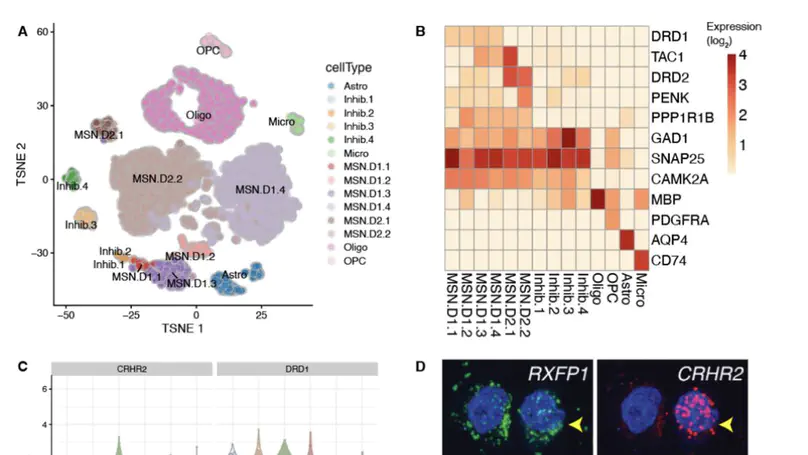
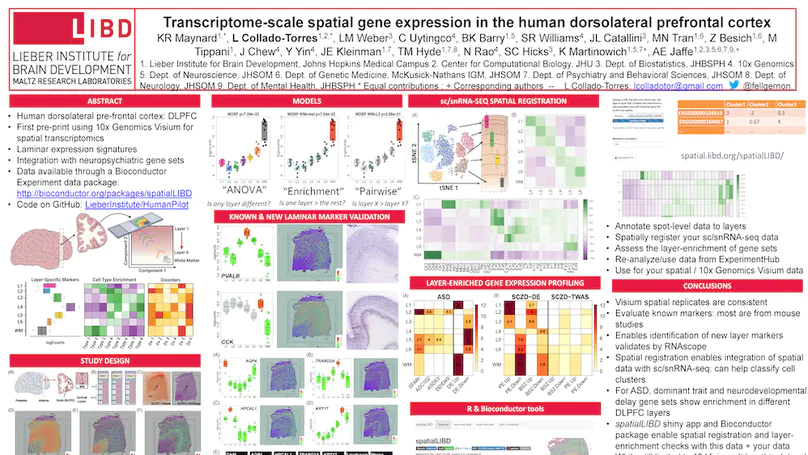
We used the 10x Genomics Visium platform to define the spatial topography of gene expression in the six-layered human dorsolateral prefrontal cortex. We identified extensive layer-enriched expression signatures and refined associations to previous laminar markers. We overlaid our laminar expression signatures on large-scale single nucleus RNA-sequencing data, enhancing spatial annotation of expression-driven clusters. By integrating neuropsychiatric disorder gene sets, we showed differential layer-enriched expression of genes associated with schizophrenia and autism spectrum disorder, highlighting the clinical relevance of spatially defined expression. We then developed a data-driven framework to define unsupervised clusters in spatial transcriptomics data, which can be applied to other tissues or brain regions in which morphological architecture is not as well defined as cortical laminae. Last, we created a web application for the scientific community to explore these raw and summarized data to augment ongoing neuroscience and spatial transcriptomics research (http://research.libd.org/spatialLIBD).
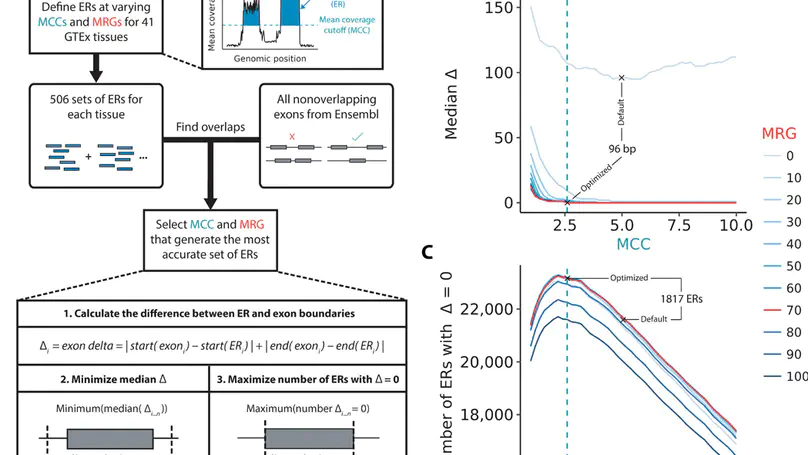
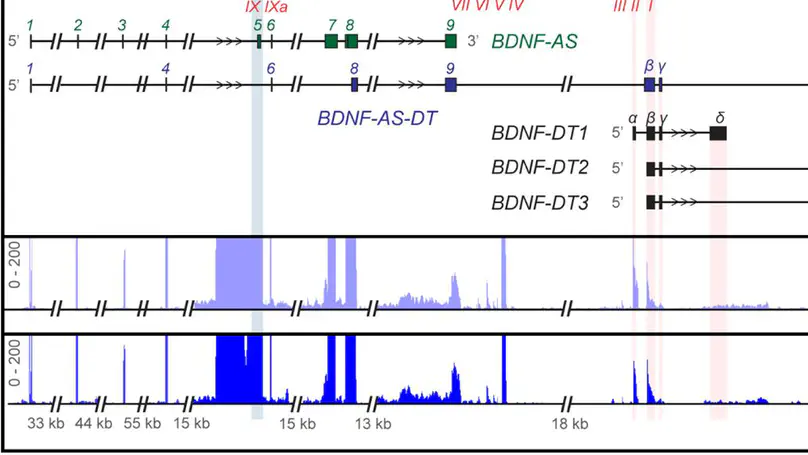
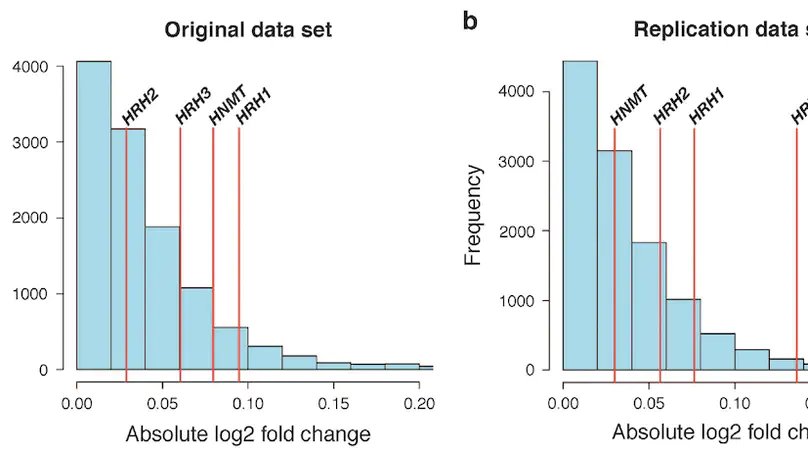
Growing evidence suggests that human gene annotation remains incomplete; however, it is unclear how this affects different tissues and our understanding of different disorders. Here, we detect previously unannotated transcription from Genotype-Tissue Expression RNA sequencing data across 41 human tissues. We connect this unannotated transcription to known genes, confirming that human gene annotation remains incomplete, even among well-studied genes including 63% of the Online Mendelian Inheritance in Man–morbid catalog and 317 neurodegeneration-associated genes. We find the greatest abundance of unannotated transcription in brain and genes highly expressed in brain are more likely to be reannotated. We explore examples of reannotated disease genes, such as SNCA, for which we experimentally validate a previously unidentified, brain-specific, potentially protein-coding exon. We release all tissue-specific transcriptomes through vizER: http://rytenlab.com/browser/app/vizER. We anticipate that this resource will facilitate more accurate genetic analysis, with the greatest impact on our understanding of Mendelian and complex neurogenetic disorders.
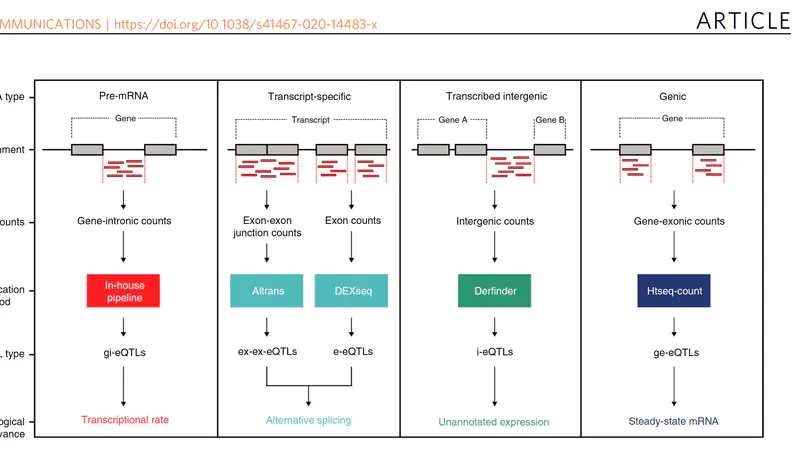
Genome-wide association studies have generated an increasing number of common genetic variants associated with neurological and psychiatric disease risk. An improved understanding of the genetic control of gene expression in human brain is vital considering this is the likely modus operandum for many causal variants. However, human brain sampling complexities limit the explanatory power of brain-related expression quantitative trait loci (eQTL) and allele-specific expression (ASE) signals. We address this, using paired genomic and transcriptomic data from putamen and substantia nigra from 117 human brains, interrogating regulation at different RNA processing stages and uncovering novel transcripts. We identify disease-relevant regulatory loci, find that splicing eQTLs are enriched for regulatory information of neuron-specific genes, that ASEs provide cell-specific regulatory information with evidence for cellular specificity, and that incomplete annotation of the brain transcriptome limits interpretation of risk loci for neuropsychiatric disease. This resource of regulatory data is accessible through our web server, http://braineacv2.inf.um.es/.
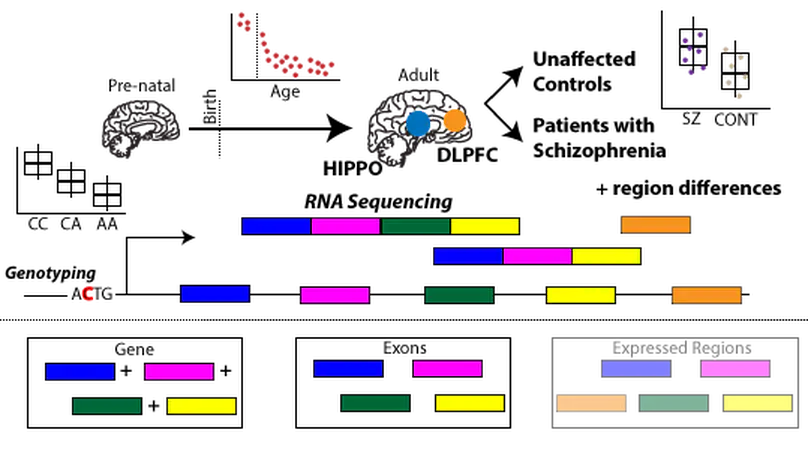
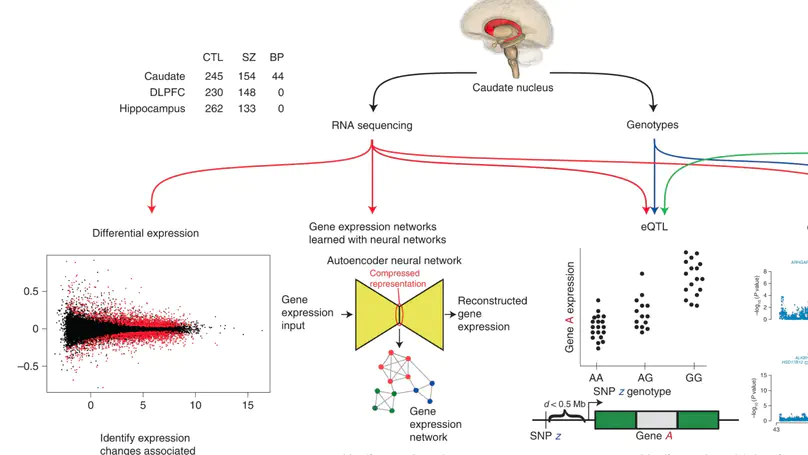
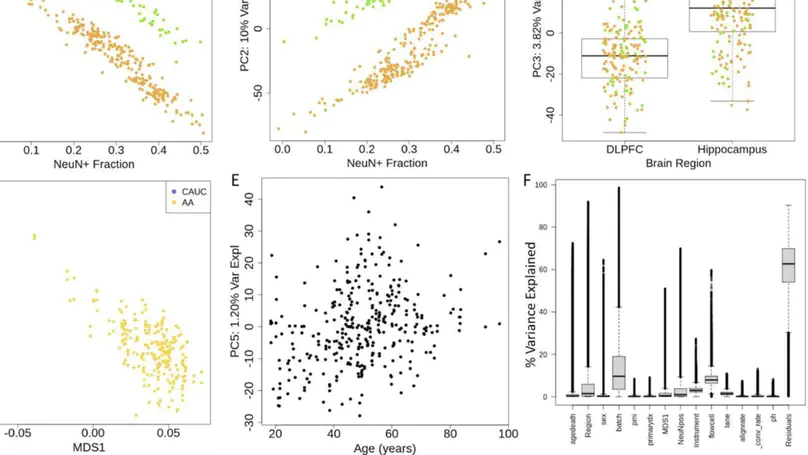
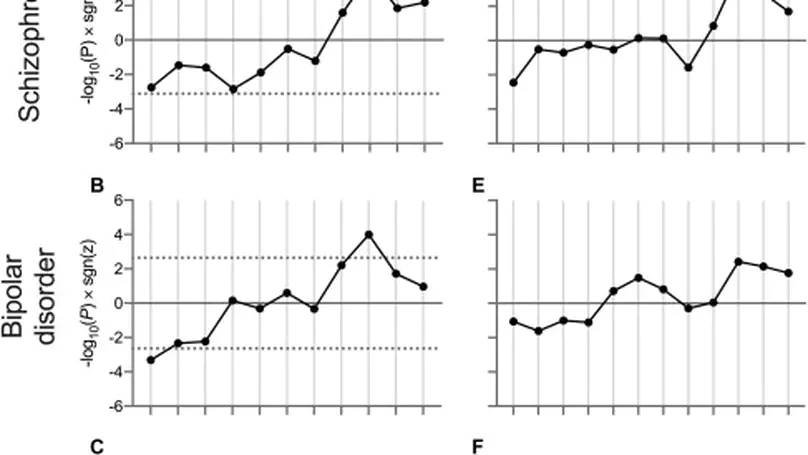
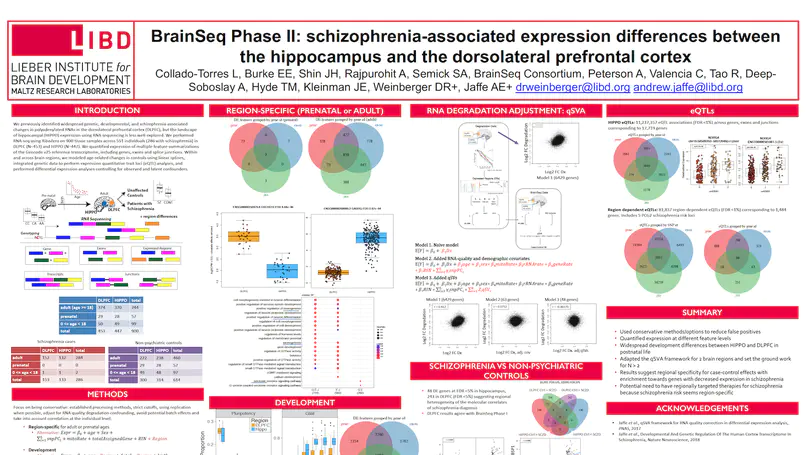
Genome-wide association studies have identified 108 schizophrenia risk loci, but biological mechanisms for individual loci are largely unknown. Using developmental, genetic and illness-based RNA sequencing expression analysis in human brain, we characterized the human brain transcriptome around these loci and found enrichment for developmentally regulated genes with novel examples of shifting isoform usage across pre- and postnatal life. We found widespread expression quantitative trait loci (eQTLs), including many with transcript specificity and previously unannotated sequence that were independently replicated. We leveraged this general eQTL database to show that 48.1% of risk variants for schizophrenia associate with nearby expression. We lastly found 237 genes significantly differentially expressed between patients and controls, which replicated in an independent dataset, implicated synaptic processes, and were strongly regulated in early development. These findings together offer genetics- and diagnosis-related targets for better modeling of schizophrenia risk. This resource is publicly available at http://eqtl.brainseq.org/phase1.
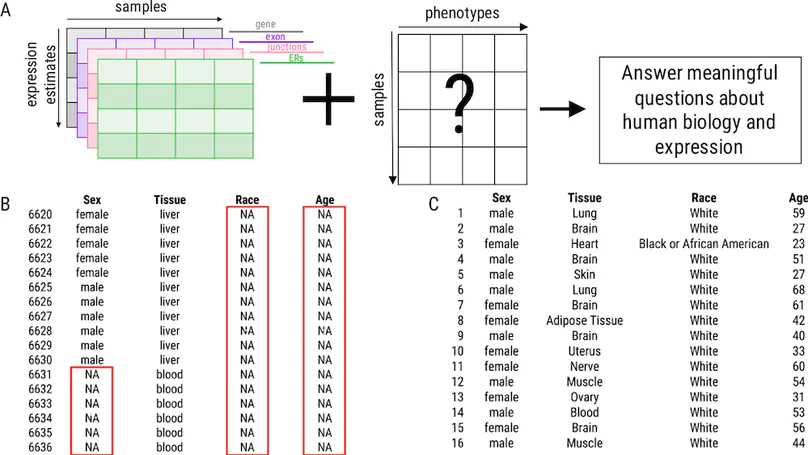
Background: Publicly available genomic data are a valuable resource for studying normal human variation and disease, but these data are often not well labeled or annotated. The lack of phenotype information for public genomic data severely limits their utility for addressing targeted biological questions. Results: We develop an in silico phenotyping approach for predicting critical missing annotation directly from genomic measurements using, well-annotated genomic and phenotypic data produced by consortia like TCGA and GTEx as training data. We apply in silico phenotyping to a set of 70,000 RNA-seq samples we recently processed on a common pipeline as part of the recount2 project (https://jhubiostatistics.shinyapps.io/recount/). We use gene expression data to build and evaluate predictors for both biological phenotypes (sex, tissue, sample source) and experimental conditions (sequencing strategy). We demonstrate how these predictions can be used to study cross-sample properties of public genomic data, select genomic projects with specific characteristics, and perform downstream analyses using predicted phenotypes. The methods to perform phenotype prediction are available in the phenopredict R package (https://github.com/leekgroup/phenopredict) and the predictions for recount2 are available from the recount R package (https://bioconductor.org/packages/release/bioc/html/recount.html). Conclusion: Having leveraging massive public data sets to generate a well-phenotyped set of expression data for more than 70,000 human samples, expression data is available for use on a scale that was not previously feasible.
![recount workflow: Accessing over 70,000 human RNA-seq samples with Bioconductor [version 1; referees: 1 approved, 2 approved with reservations]](/publication/2017-08_recountworkflow/featured_hu3895338370ae321089968d378f88b52e_7454_808x455_fill_q75_h2_lanczos_smart1_3.webp)
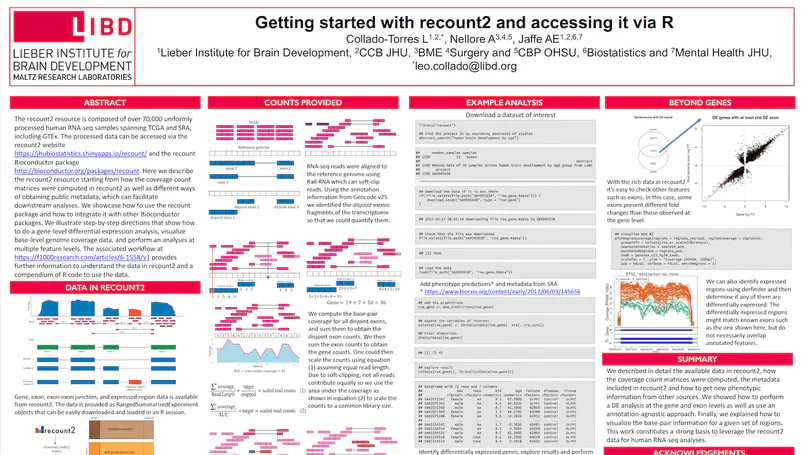
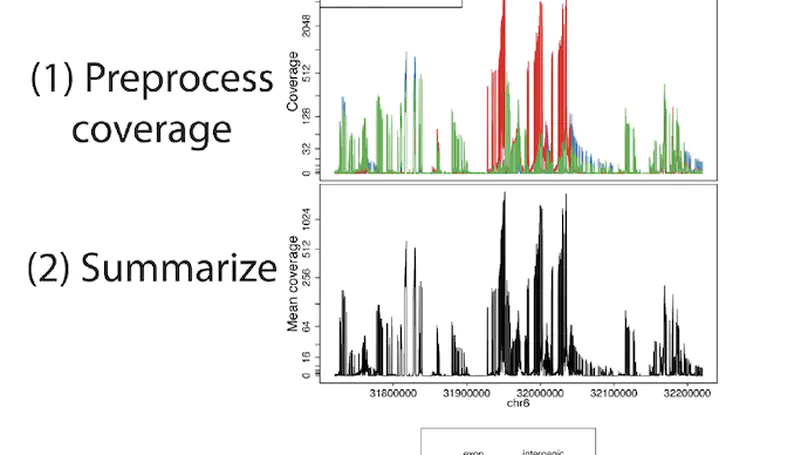
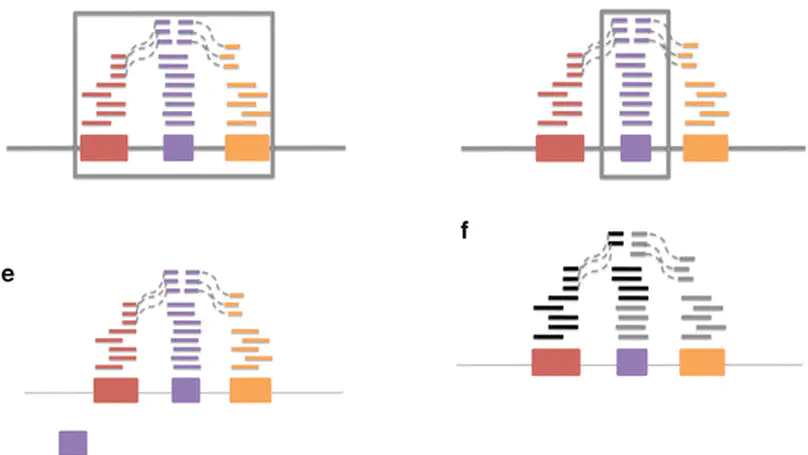
recount2 is a resource of processed and summarized expression data spanning over 70,000 human RNA-seq samples from the Sequence Read Archive (SRA). The associated recount Bioconductor package provides a convenient API for querying, downloading, and analyzing the data. Each processed study consists of meta/phenotype data, the expression levels of genes and their underlying exons and splice junctions, and corresponding genomic annotation. We also provide data summarization types for quantifying novel transcribed sequence including base-resolution coverage and potentially unannotated splice junctions. We present workflows illustrating how to use recount to perform differential expression analysis including meta-analysis, annotation-free base-level analysis, and replication of smaller studies using data from larger studies. recount provides a valuable and user-friendly resource of processed RNA-seq datasets to draw additional biological insights from existing public data. The resource is available at https://jhubiostatistics.shinyapps.io/recount/.
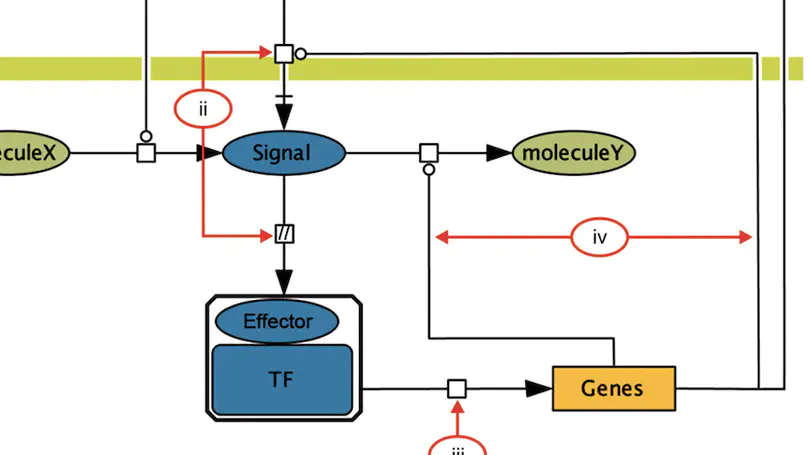
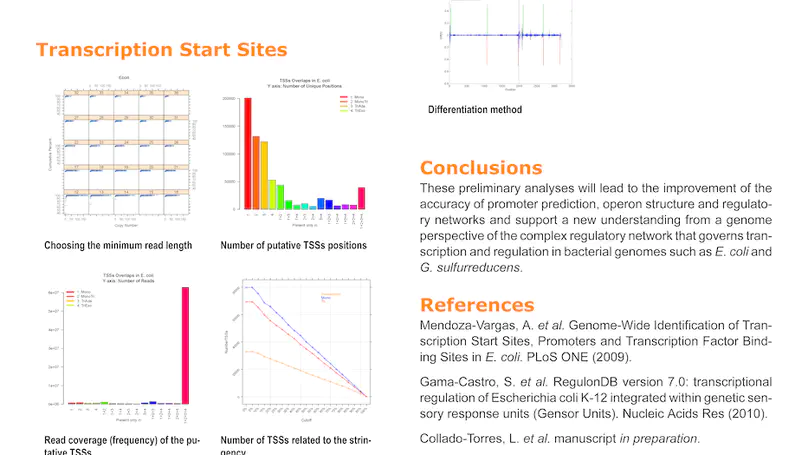
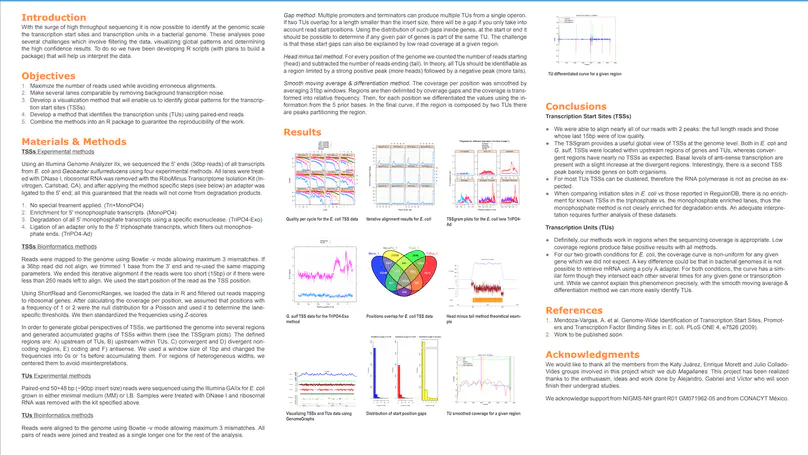
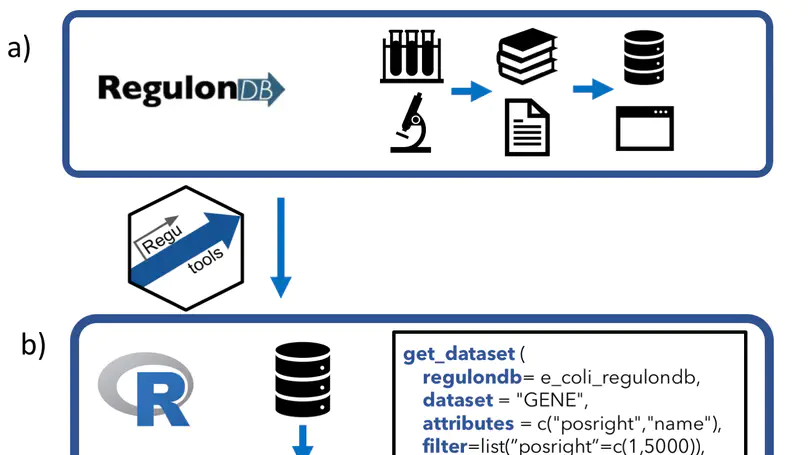
RegulonDB (http://regulondb.ccg.unam.mx/) is the primary reference database of the best-known regulatory network of any free-living organism, that of Escherichia coli K-12. The major conceptual change since 3 years ago is an expanded biological context so that transcriptional regulation is now part of a unit that initiates with the signal and continues with the signal transduction to the core of regulation, modifying expression of the affected target genes responsible for the response. We call these genetic sensory response units, or Gensor Units. We have initiated their high-level curation, with graphic maps and superreactions with links to other databases. Additional connectivity uses expandable submaps. RegulonDB has summaries for every transcription factor (TF) and TF-binding sites with internal symmetry. Several DNA-binding motifs and their sizes have been redefined and relocated. In addition to data from the literature, we have incorporated our own information on transcription start sites (TSSs) and transcriptional units (TUs), obtained by using high-throughput whole-genome sequencing technologies. A new portable drawing tool for genomic features is also now available, as well as new ways to download the data, including web services, files for several relational database manager systems and text files including BioPAX format.