## For a) we need to use he function anno_barplot() to generate the barplot and gpar() to fill the bars
top_ans <- HeatmapAnnotation(
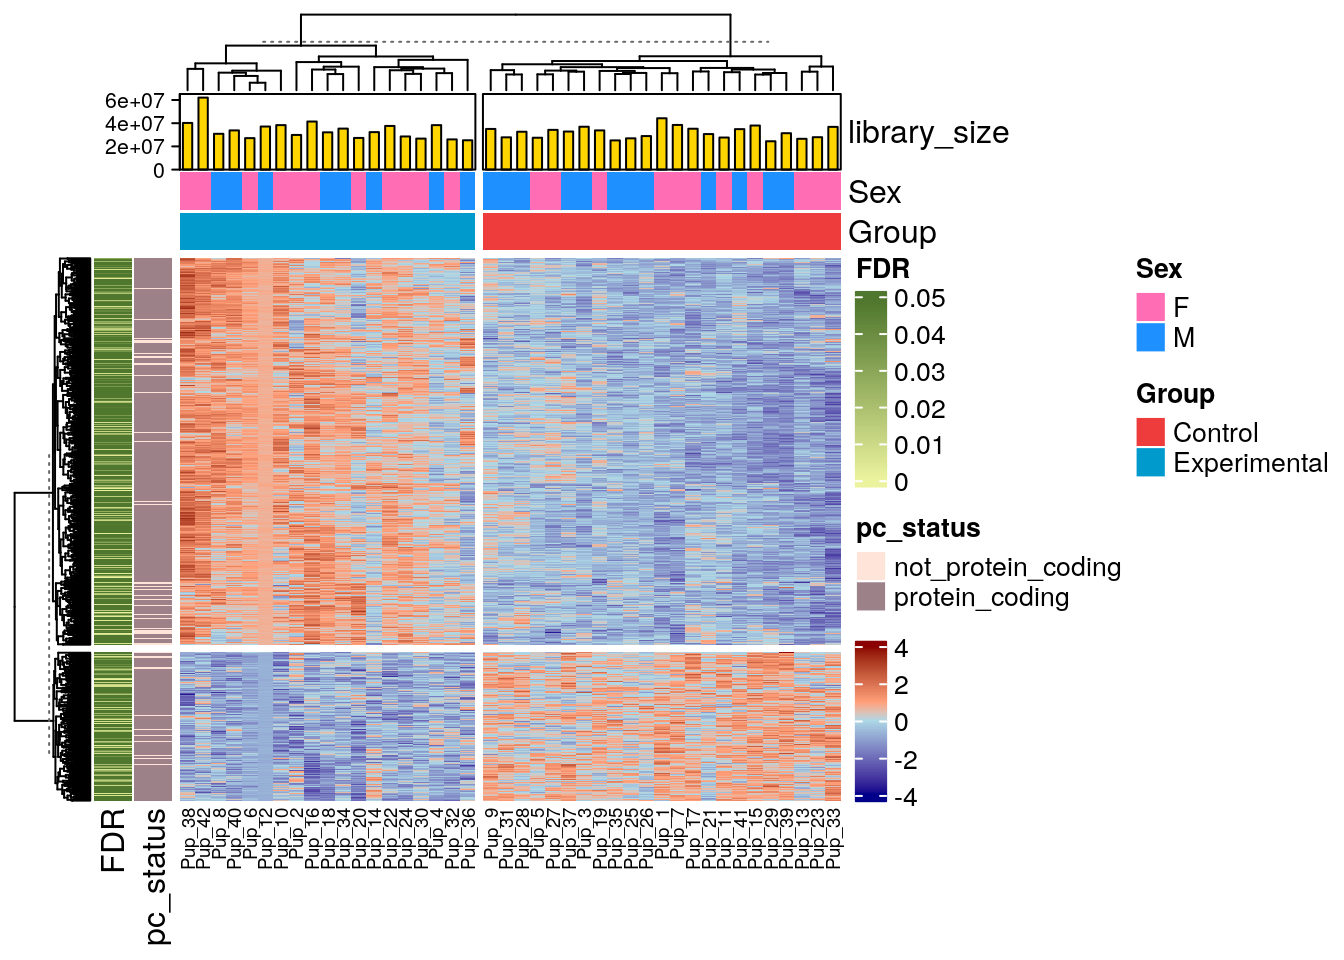
df = as.data.frame(colData(rse_gene_pup_nic)[, c("Sex", "Group")]),
library_size = anno_barplot(colData(rse_gene_pup_nic)$sum, gp = gpar(fill = "#ffd500")),
col = list(
"Sex" = c("F" = "hotpink1", "M" = "dodgerblue"),
"Group" = c("Control" = "brown2", "Experimental" = "deepskyblue3")
)
)
## For b), I want to know if a gene is protein_coding or not_protein_coding.
## First, we can explore the rowData of our object to see if we have a column with
## that information
names(rowData(rse_gene_pup_nic))
#> [1] "Length" "gencodeID" "ensemblID"
#> [4] "gene_type" "EntrezID" "Symbol"
#> [7] "meanExprs" "retained_after_feature_filtering" "DE_in_adult_blood_smoking"
#> [10] "DE_in_adult_brain_nicotine" "DE_in_adult_brain_smoking" "DE_in_pup_brain_nicotine"
#> [13] "DE_in_pup_brain_smoking" "FDR"
## Maybe gene_type has what we need
unique(rowData(rse_gene_pup_nic)$gene_type)
#> [1] "sense_intronic" "protein_coding" "antisense"
#> [4] "processed_transcript" "unprocessed_pseudogene" "processed_pseudogene"
#> [7] "TEC" "transcribed_processed_pseudogene" "lincRNA"
#> [10] "transcribed_unitary_pseudogene" "snoRNA" "polymorphic_pseudogene"
#> [13] "transcribed_unprocessed_pseudogene" "bidirectional_promoter_lncRNA"
## It does but not in the format we need it, so we need to create a new column to complete the task
## This columns is going to have protein_coding and not_protein_coding as elements
rowData(rse_gene_pup_nic)$pc_status <- "protein_coding"
rowData(rse_gene_pup_nic)$pc_status[rowData(rse_gene_pup_nic)$gene_type != "protein_coding"] <- "not_protein_coding"
## Now we can add the information and specify the color
left_ans <- rowAnnotation(
FDR = sample(x = 0:5000, size = dim(rse_gene_pup_nic)[1], prob = c(rep(0.0012, 1001), rep(0.00005, 4000))) / 10000,
pc_status = rowData(rse_gene_pup_nic)$pc_status,
col = list(FDR = colorRamp2(c(0, 0.049), c("#ecf39e", "#4f772d")), pc_status = c("not_protein_coding" = "#ffe5d9", "protein_coding" = "#9d8189")),
annotation_legend_param = list(FDR = list(at = c(0, 0.01, 0.02, 0.03, 0.04, 0.05)))
)
Heatmap(logs_pup_nic,
    name = " ",
    show_row_names = FALSE,
    top_annotation = top_ans,
    left_annotation = left_ans,
    row_km = 2,
    column_km = 2,
    col = colorRamp2(c(-4, -0.0001, 00001, 4), c("darkblue", "lightblue", "lightsalmon", "darkred")),
    row_title = NULL,
    column_title = NULL,
    column_names_gp = gpar(fontsize = 7)
)